Not everyone is a fan of GUI interfaces. But some tasks really lend themselves to something over a bare command line. Very few people enjoy old command line text editors like edlin or ed. Debugging is another task where showing source files and variables at all times makes sense. Of course, you don’t absolutely have to have a GUI per se. You can also use a Text User Interface (TUI). In fact, you can build gdb — the GNU Debugger — with a built-in TUI mode. Try adding –tui to your gdb command line and see what happens. There are also many GUI frontends for gdb, but [cyrus-and] has an easy way to get a very useful TUI-like interface to gdb that doesn’t require rebuilding gdb or even hacking its internals in any way.
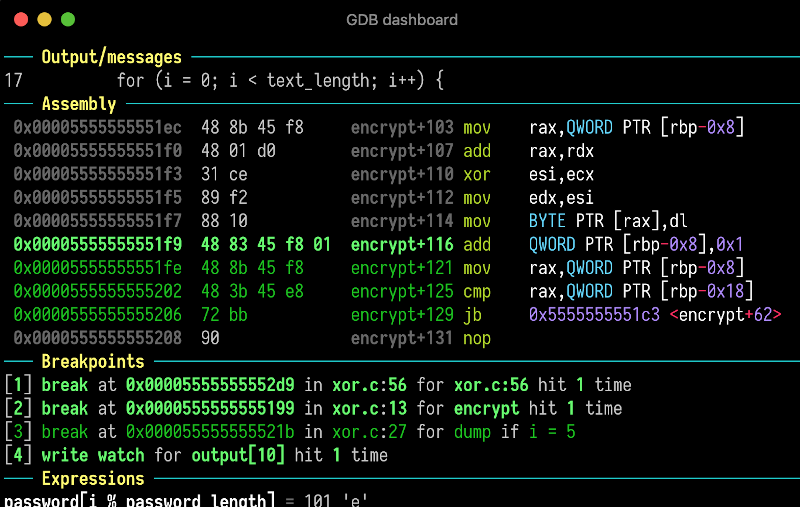
The secret? The gdb program runs a .gdbinit file on startup. By using Python and some gdb commands, [cyrus-and] causes the debugger to have a nice dashboard interface for your debugging sessions. If you install a helper script, you can even get syntax highlighting.
The system uses modules and you can even add your own custom modules and commands, if you like. You can also control what modules appear on each dashboard display. Normally, the dashboard shows when the program stops. For example, on each breakpoint. However, gdb has a hook system that allows you to trigger a dashboard using the appropriately-named dashboard command on other commands, too. Using the layout option to the dashboard command, you can even trigger different modules at different times.
Installation is simple. Just put the .gdbinit file in your home directory. If you want syntax highlights, you need to install Pygments, too. We understand you can even use his under Windows, if you like.
We don’t always take full advantage, but gdb is actually amazing. The flexible architecture makes all sorts of interesting things possible.


0 Commentaires